
i-line
2.4 LPA
Annual Package
If you're looking for the best QlikView training institute in Bangalore, then 4achievers is the place to go. Located in Bangalore, 4achievers offers a comprehensive QlikView course that covers all the essential topics. 4Achievers course syllabus is designed to ensure that students gain a thorough understanding of the subject, while the course fees are highly competitive. Furthermore, 4achievers provides placement for Job ready candidates opportunities, internships, and jobs after the completion of the course. For those who are unable to attend the course in-person, 4achievers also offers an online version of the course. Additionally, the course is also suitable for those who have just completed their 12th grade. So don't hesitate! Contact us today on +91 8010805667 or send us an email at info@4achievers.com to find out more about the QlikView course near you. With 4achievers, you can be sure that you will receive the best training and guidance to help you become a successful QlikView professional.
Live stats from top hiring partners
Limited Counselling Slots Available
Our team will contact you shortly.
Please keep your phone and email active.
We don't just teach; we transform careers. Here are some of our recent graduates who cracked high-paying cloud and IT jobs at top product companies.
Annual Package
Annual Package
Annual Package
Annual Package
Annual Package
Annual Package
"I was working in a BPO for 3 years, feeling stuck. I had zero coding knowledge and thought IT was impossible for me. That's when I found 4Achievers."
The first week was overwhelming, but the way they taught Python from scratch changed my perspective. I didn't just learn syntax; I learned how to think like a developer.
The toughest part was Data Structures. I almost quit. But my mentor, Rahul Sir, sat with me on a Sunday for 3 hours just to clear my doubts on Linked Lists.
That support system is rare. We built a Real-time E-commerce App as a capstone project. Seeing my code run live gave me confidence I never had before.
Explore roles from our hiring partners.
Our students are working in top MNCs and Startups across the globe.
Comprehensive 40+ hours of live content designed by industry experts.
Click on modules to view detailed topics.
Total Modules
6 Topics • Hands-on Lab
6 Topics • Hands-on Lab
6 Topics • Hands-on Lab
6 Topics • Hands-on Lab
6 Topics • Hands-on Lab
6 Topics • Hands-on Lab
6 Topics • Hands-on Lab
6 Topics • Hands-on Lab
6 Topics • Hands-on Lab
6 Topics • Hands-on Lab
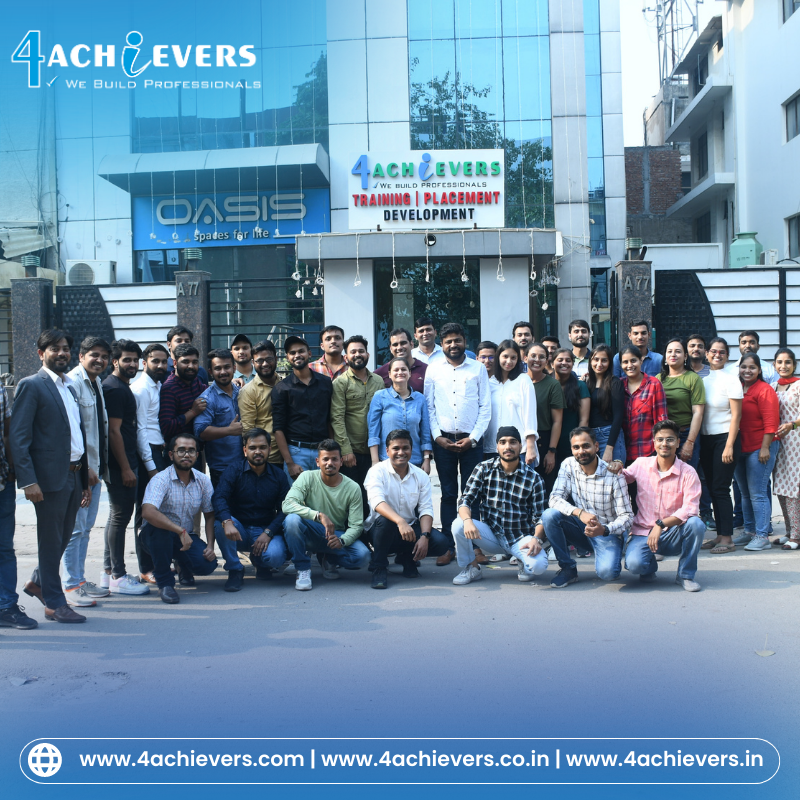
Sneak peek into our Live Classroom Sessions, practical labs, and placement drives in Noida.
Campus Life

Campus Life

Campus Life
Campus Life
Campus Life
Reserve your spot in our next instructor-led interactive session.
Handpicked curriculum designed to expand your skill set.
 Civil Design
4Achievers AutoCAD Training in Bangalore Course Covers: Introduction | Basic | Project Implementation | Testing | Architecture | Advance Learning | Interview Preparation | JOB Assistance
 Civil Design
4Achievers MS Project Training in Bangalore Course Covers: Introduction | Basic | Project Implementation | Testing | Architecture | Advance Learning | Interview Preparation | JOB Assistance
 Civil Design
4Achievers Revit Training in Bangalore Course Covers: Introduction | Basic | Project Implementation | Testing | Architecture | Advance Learning | Interview Preparation | JOB Assistance
 Civil Design
4Achievers SolidWorks Training in Bangalore Course Covers: Introduction | Basic | Project Implementation | Testing | Architecture | Advance Learning | Interview Preparation | JOB Assistance
 Civil Design
4Achievers QlikView Training in Bangalore Course Covers: Introduction | Basic | Project Implementation | Testing | Architecture | Advance Learning | Interview Preparation | JOB Assistance
 Civil Design
4Achievers STAAD Pro Training in Bangalore Course Covers: Introduction | Basic | Project Implementation | Testing | Architecture | Advance Learning | Interview Preparation | JOB Assistance
Verified feedback from professionals who achieved their career goals through our training programs.
"I recently enrolled for the Online Python Training course provided by 4achievers and I must say it was an amazing experience. The trainers were experienced and knowledgeable and were able to answer all my queries related to the course. The course material was well designed and the assignments were challenging. I am really happy with the overall experience and I would definitely recommend this course to anyone who is looking for a comprehensive and interactive learning experience."
"I recently completed the Networking course provided by 4achievers and I’m really satisfied with the quality of the training. The trainers were knowledgeable and experienced in the field of networking. They provided me with a comprehensive understanding of all the concepts and they also offered great hands on experience to help me apply what I learned. The online platform was great and the materials provided were comprehensive. I would highly recommend this course to anyone who is looking to build a good foundation in networking."
"I recently took the Corporate Training in Machine Learning course provided by 4achievers and I am glad that I did. The course was very well structured and the instructor was very knowledgeable and helpful throughout the whole training program. The course provided me with a strong foundation in machine learning and gave me an insight into the different aspects of the technology. I was able to understand and apply the concepts in my current work. The course was also very informative and was packed with a lot of useful information which I can use in the future. I would highly recommend this course to anyone who is interested in learning about machine learning."
"This course is really great. It covers all the basics of Mean Stack development - from the basics of JavaScript, to Node.js and Mongo DB. The course is well-structured and the instructor does a great job explaining the concepts. The assignments are also a great way to test your knowledge and practice. All in all, this is an excellent choice for anyone looking to learn Mean Stack development. Highly recommended!"
"This course was a great experience for me. The instructor was very knowledgeable and was able to explain the concepts in a clear and concise manner. He was able to answer all of my questions and was able to provide real-world examples to help me understand the material better. The course was very comprehensive and covered all of the topics I wanted to learn. I was able to gain a deep understanding of the subject matter and I am now confident that I can apply what I have learned in the workplace. I highly recommend this course to anyone who wants to get a better understanding of the topics covered."
"The ETL Testing course provided by 4achievers was an incredibly comprehensive and helpful learning experience. The instructor was knowledgeable, experienced, and patient with the students. He provided detailed explanations of the concepts and went above and beyond in answering questions. The course materials were easy to follow and the assignments were helpful in solidifying the concepts. I would highly recommend this course to anyone looking to learn more about ETL Testing."
"I recently took the Data Mining with Python course provided by 4achievers and I am very satisfied with the course. The course covered all the important topics related to data mining such as data pre-processing, feature selection, model building, validation, and visualization. The instructor was very knowledgeable and provided clear explanations and examples throughout the course. I was able to follow along easily and I gained a lot of insight from the course. The course also provided a lot of practical exercises which allowed me to apply my knowledge and gain a better understanding of the subject. Overall, I had a great experience and I would highly recommend this course to anyone who is interested in data mining."
"I recently completed the Data Science Associate course provided by 4achievers. It was a comprehensive course that covered all the essential topics in the field of data science. The course was delivered in a well-structured manner and there were plenty of hands-on exercises and projects to help me understand the concepts better. The instructor was very knowledgeable and was always available to answer any queries that I had. The course also included online lectures and materials, which were really helpful. Overall, I was really happy with my experience and would definitely recommend this course to anyone looking to learn more about data science."
Expert tutorials, career trends, and technical deep-dives.

Learn how to become a data scientist in India with skills, tools, salary insights & career roadmap. Start your journey with expert guidance from 4Achievers.
Learn how to become a software tester with this step-by-step guide. Explore skills, certifications, career scope & training from 4Achievers.

Discover how to become a data analyst in India with skills, tools, salary insights & career roadmap. Start your journey with expert training at 4Achievers.
Learn how to become a full stack developer with a step-by-step guide covering skills, tools, roadmap & training. Start your tech career with 4Achievers.
Learn how to become a Python developer in 2026 with skills, roadmap, salary insights & certification guidance. Start your career journey with 4Achievers.

Learn how to become an AWS developer in 2026 with skills, certifications, salary insights & career roadmap. Start your cloud journey with 4Achievers.